Dynamically Resolving Windows API Functions via the PEB_LDR_DATA struct
Introduction:
The traditional way to use libraries in programs is to either statically or dynamically link them to the final executables, with the latter being the most preferred (usually) since it allows for better resource consumption (smaller executables and code sharing among processes’ address spaces). When linking statically, you copy the necessary code into the final executable thereby making it part of it. When linking dynamically, you include references to the library code you’re reusing, which the operating system’s loader then fetches for you upon execution.
Furthermore, there exists two types of dynamic linking: Explicit and Implicit. The first is concerned with the program resolving the code it needs manually by means of the dedicated Windows API functions: LoadLibrary() and GetProcAddress(). As for the second type, the developers link their code with the .lib files associated with the DLLs they’re using, which yields PE files that contain in its imports table references to the libraries and functions they rely on. This imports table is then used by the operating system when loading the program in order to satisfy these dependencies.
For most software, implicit dynamic linking is the most efficient, convenient, and therefore most obvious choice for handling dependencies. For malware however, it is less desirable since it can make the malicious code more detectable and easier to analyze. This is because the transparency of the imports table can be leveraged by analysts or automation tools to triage the malware more quickly and efficiently.
As a result, malware and shellcode authors try to opt for more stealthy methods to resolve their dependencies, and one of the most common ones is to leech off of the DLLs that the host process already has loaded in its vaddress space. In this blogpost, I will try to document this approach while going over a practical example taken from a metasploit-generated file virus.
The approach in a nutshell:
When windows loads a DLL module into a process’s virtual address space, it loads the entire PE file including the exports table. So if we can get the starting vaddress of that module, we can navigate to and parse its exports table to resolve the vaddress of any of its exports. Luckily for us, Windows stores all information regarding a process’s loaded modules in a dedicated list, and makes it accessible to that process through the Process Environment Block (PEB) structure.
As a consequence, our approach can be summarized in the following main steps:
- Get the list of loaded modules from the PEB.
- Find the address of our target DLL from the PEB_LDR_DATA list.
- Parse the module’s exports table to resolve the addresses we need.
In the following sections, we’ll be going over the main tenets of these steps.
PEB and TEB:
Each process on Windows has a dedicated PEB struct that contains key information for that process. Furthermore, each thread on that process also has a dedicated struct called the Thread Environment Block (TEB) that contains key information for that thread. Locating these structs is crucial to executing our approach since they contain the information we need.
Both the PEB and the TEB were meant for internal use only by the operating system, and are therefore not well documented by Microsoft. However, researchers have been able to find the significance of obscure fields using several methods, such as parsing publicly available debug information. Examples of such efforts include Aldeid’s security wiki and bytepointer.
Examining the contents of the TEB struct as per these websites, we can see that it contains a pointer to the parent process’s PEB block. Furthermore, Aldeid also tells us that the TEB is accessible using the FS segment register. See Figure 1 below.
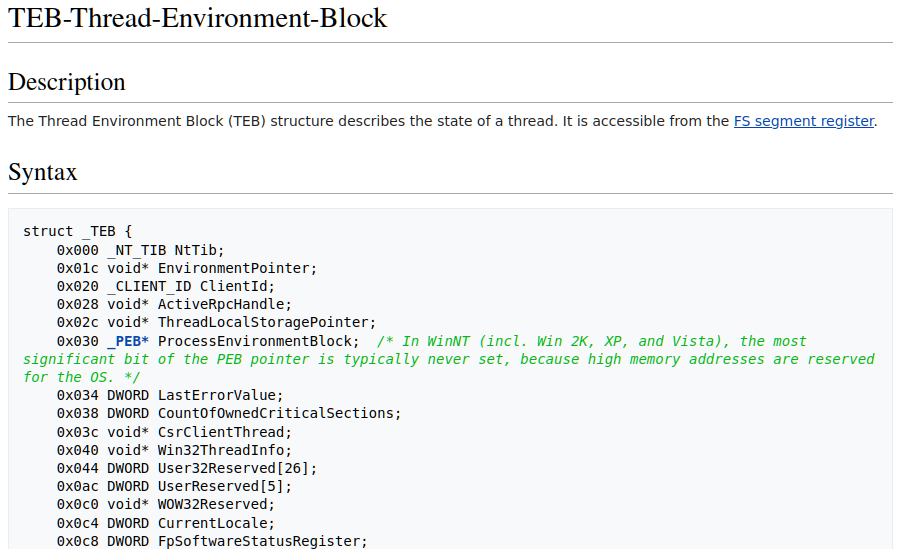 Figure 1: Contents of the TEB structs per Aldeid
As a consequence, in order to access the PEB all we’d need to do is to read the DWORD at a 0x30 bytes offset from the FS segment register, and we would have the base pointer for the PEB struct. Keep in mind however that this is relevant for 32-bit systems only; on 64-bit the PEB reference is at a 0x60 bytes offset from the GS register instead.
According to Aldeid, the PEB is composed of 66 fields that contain varying information about the process such as: a pointer to the heap, a pointer to KernelCallbackTable (suggested read: how lazarus used KernelCallbackTable poisoning for control flow hijacking), and most importantly in our case a pointer to the PEB_LDR_DATA struct which has information about the process’s loaded modules.
Process-loaded modules (PEB_LDR_DATA):
This struct can be obtained by dereferencing the DWORD at the offset 0xc of the PEB (on 32-bit systems). In addition to metadata, it contains references to 3 doubly-linked lists that hold information about the process’ loaded modules. Each element of these 3 lists is a PEB_LDR_TABLE_ENTRY struct that corresponds to one of the loaded modules. The elements in these lists are the exact same, with the only difference between the lists being that they present the modules in different orders such as: Loading order, Memory placement order, and Initialization order.
The forward and backward pointers affiliated with each of the 3 lists are grouped together into a small struct named LIST_ENTRY, and are placed together at the start of each PEB_LDR_TABLE_ENTRY. Given a certain module, we can use the appropriate LIST_ENTRY to find the next and previous modules following any of the aforementioned orders.
One nuance that’s worth mentioning is the pointers associated with each list do not necessarily point at the start of the PEB_LDR_TABLE_ENTRY structure. Instead, they point to the relevant LIST_ENTRY within that structure. For instance, the Flink member of the InMemoryOrderLinks LIST_ENTRY struct points 0x8 bytes into the next PEB_LDR_TABLE_ENTRY rather than at the start of it. For illustration of this, please refer to Figure 2 which assumes that modules n preceeds n+1 in all orders (to make things easier to explain).
 Figure 2: Illustrative diagram of how the loaded-modules linked list works
This means that when resolving the offsets for fields in the PEB_LDR_TABLE_ENTRY structure, we must take into account which list we’re following. If it’s the InMemoryOrderLinks one, then we’d need to subtract 8 bytes from the computed offsets (granted that we’re looking for a field that comes after it).
LDR_DATA_TABLE_ENTRY:
With the linked list mechanisms out of the way, we can focus more on the other fields that are useful for our case. Aldeid’s definition of this struct is the following:
1
2
3
4
5
6
7
8
9
10
11
12
13
14
15
16
17
18
19
20
21
22
23
24
25
26
27
28
29
30
31
32
33
34
35
36
37
38
39
40
typedef struct _LDR_DATA_TABLE_ENTRY
{
    LIST_ENTRY InLoadOrderLinks; /* 0x00 */
    LIST_ENTRY InMemoryOrderLinks; /* 0x08 */
    LIST_ENTRY InInitializationOrderLinks; /* 0x10 */
    PVOID DllBase; /* 0x18 */
    PVOID EntryPoint; /* 0x1C */
    ULONG SizeOfImage; /* 0x20 */
    UNICODE_STRING FullDllName; /* 0x24 */
    UNICODE_STRING BaseDllName; /* 0x2C */
    ULONG Flags; /* 0x34 */
    union {
        UCHAR FlagGroup [4];
        ULONG Flags;
        struct {
            /*  bit fields, see below  */
        };
    };
    WORD LoadCount; /* 0x38 */
    WORD TlsIndex; /* 0x3A */
    union /* 0x3C */
    {
         LIST_ENTRY HashLinks;
         struct
         {
              PVOID SectionPointer;
              ULONG CheckSum;
         };
    };
    union
    {
         ULONG TimeDateStamp;
         PVOID LoadedImports;
    };
    _ACTIVATION_CONTEXT * EntryPointActivationContext;
    PVOID PatchInformation;
    LIST_ENTRY ForwarderLinks;
    LIST_ENTRY ServiceTagLinks;
    LIST_ENTRY StaticLinks;
} LDR_DATA_TABLE_ENTRY, *PLDR_DATA_TABLE_ENTRY;
The most important fields for us are the DllBase (offset 0x18) and DllBaseName (offset 0x2c). The first field is a pointer to the start of the module’s in-memory image, while the second field is a UNICODE_STRING structure (offset 0x2c) which contains the following fields (per MSDN):
1
2
3
4
5
typedef struct _UNICODE_STRING {
  USHORT Length;
  USHORT MaximumLength; /* Allocated memory for the Buffer member */
  PWSTR  Buffer; /* Buffer of wide characters */
} UNICODE_STRING, *PUNICODE_STRING;
As a conclusion, once we get to one of the module lists, we can examine each element and check whether the DllBaseName.Buffer field matches the DLL we’re looking for. If it does, we can then consult the DllBase field to get the vaddress of the PE image for the DLL we’re looking for.
Recap:
To go over the main points we’ve talked about thus far and highlight the important parts, I’ll go through how a metasploit file-virus I came across recently was dynamically resolving the process’ loaded modules.
Figure 3 below shows the code that fetches the first module the process loaded. The most important bits have been highlighted.
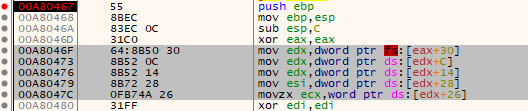 Figure 3: Shellcode Fetching the first process-loaded module
The first highlighted instruction copies the pointer at a 0x30 bytes offset from the vaddress contained in the FS register. As we’ve seen earlier, the FS register contains the vaddress of the TEB struct, while offset 0x30 contains a pointer to the PEB struct. Therefore, executing this instruction puts the vaddress of the PEB in the edx register.
The instruction after that offsets 12 bytes into the PEB, which we know corresponds to the PEB_LDR_DATA struct which contains the heads of the 3 different lists of modules. As we can see from the instruction that follows this, the code is grabbing the pointer at a 0x14 offset from the start of the PEB_LDR_DATA; this corresponds to the InMemoryOrderModuleList member, therefore after this instruction executes edx will have the address of the first PEB_LDR_TABLE_ENTRY struct.
Finally, the last two instructions grab the name’s buffer and buffer length respectively, which will later be used to search for the target DLL. Once found, the code executes the instructions depicted in Figure 4 below:
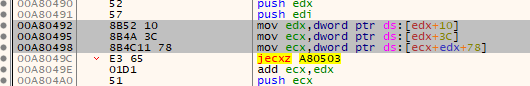 Figure 4: Shellcode Fetching The Exports Table
With the edx register still pointing to the module’s corresponding PEB_LDR_TABLE_ENTRY struct (the inner InMemoryOrderList field to be exact), our first highlighted instruction grabs the DllBase vaddress (offset 0x10) and saves it to edx. Then, 0x3c is added to that to fetch the offset of the PE header from the MZ header. Finally, the DWORD from offset 0x78 into the PE is copied into the ecx register, which corresponds to the offset of the exports table from the start of the DLL base image.
After this, the malware will proceed into resolving the function addresses it needs, which leads us to the next portion of this blogpost.
Parsing the exports table:
Aldeid defines the structure of PE files’ exports table as seen in Figure 5 below.
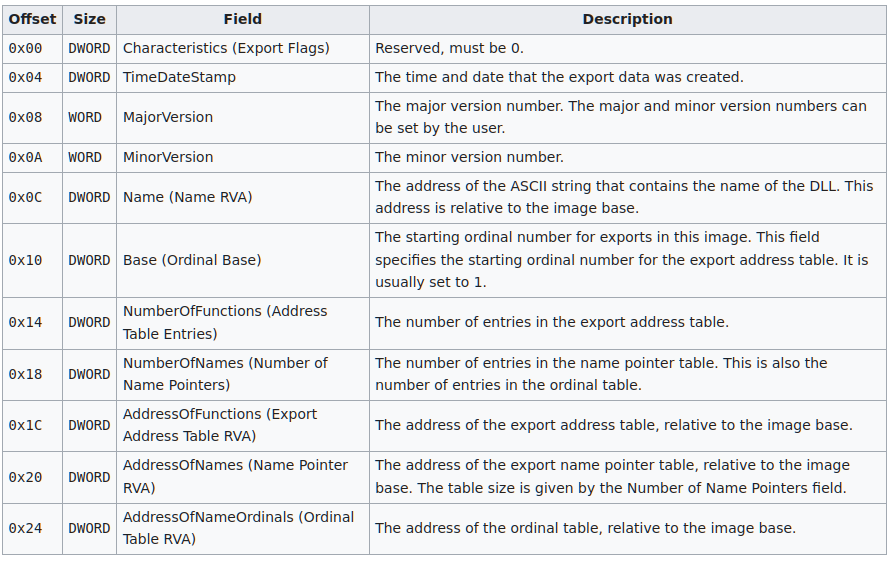 Figure 5: Structure of PE files’ exports table
Of these fields, the most important to us are the following:
- NumberOfNames: contains the number of export functions.
- AddressOfNames and AddressOfNameOrdinals: these are pointers to parallel arrays which contain the name of each function and their index into the addresses table respectively.
- AddressOfFunctions: pointer to the array which contains the addresses of the export functions.
The general algorithm for finding the vaddress of our target functions is pretty straightforward. We walk the AddressOfNames and AddressOfNameOrdinals tables in parallel (using the same index) until we find the function name we’re looking for in the AddressOfNames table. Once we do, we copy the ordinal it corresponds to from the AddressOfNameOrdinals table and use that to index into the AddressOfFunctions table and get the function’s vaddress.
The assembly code needed to do this can be seen in Figure 6 below which shows how the previously discussed Metasploit file virus walks the exports table.
 Figure 6: Shellcode that parses the exports table to find the target function
First, the green-highlighted section of code grabs the pointer to our AddressOfNames table, and initializes the index we’ll be using to search that table to the number of entries in it; later sections of the code will then be decrementing that counter with each iteration until it reaches zero, effectively going through each name in the AddressOfNames table in reverse order. This first section of the code then grabs the RVA of the name’s buffer, and adds it to the VA of the DLL’s image to get the VA of the name buffer which will be processed in the next code section.
The purple section of the code is what the malware uses to check if the current iteration’s function name is the one it’s looking for. Instead of a simple string comparison, it computes a hash of the name and compares it against a pre-computed value; if the two match, then it knows that it has found its target function. The main objective of this is to obfuscate the name of the function it’s looking for, since an analyst would need to hash all of the module’s exported names in order to check which function the malware is looking for. We’ll talk about how to circumvent these measures in the next final section.
Once the malware finds its target function, then it proceeds into executing the cyan code block which is responsible for resolving the target function’s vaddress. First, it uses the current index to the AddressOfNames table to index into the AddressOfNameOrdinals table and fetch the ordinal corresponding to the current function. Then, it indexes into the AddressOfFunctions table using that same ordinal to fetch the vaddress of our target function. Finally, it stores the resolved address into the appropriate stack variable and either moves on to the next iteration (if there’s still one more function to resolve), or quits the dynamic API resolution code altogether (if all function names have been resolved).
Tackling Module and API Hashing:
Coming back to the purple section of the code concerned with API hashing, we can circumvent this by either using a debugger or using rainbow tables.
For the first method, we can essentially set a breakpoint right after the name is resolved and see which function it was looking for. Doing so on our previous code sample, we can see that the first hash for instance corresponds to the CreateThread() API function (Figure 7).
 Figure 7: Examining the resolved function VA in a debugger by means of a breakpoint
For the second method, we can either compute our own rainbow tables using FLARE’s shellcode_hashes for instance, or rely on the extensive OALabs’ HashDB rainbow table which already includes many hashes for many malware families.
Conclusion:
In this blogpost, we’ve gone over the following points:
- Types of linking: static, dynamic implicit, dynamic explicit.
- How to locate the Process Environment Block during execution (using the TEB and FS/GS register)
- How to get the list of loaded modules in a process.
- How to find the in-memory PE images of loaded DLLs.
- How to parse the exports table of a loaded DLL during execution.
- How to circumvent API name hashing.
Combining these concepts together allows us to effectively analyze malware that dynamically imports its dependencies without having to rely on the conventional methods.